Unit economics
The math.
Every number sourced from real acquisitions, real rehab invoices, and real lease agreements. No projections. No hockey sticks.
04 · The math
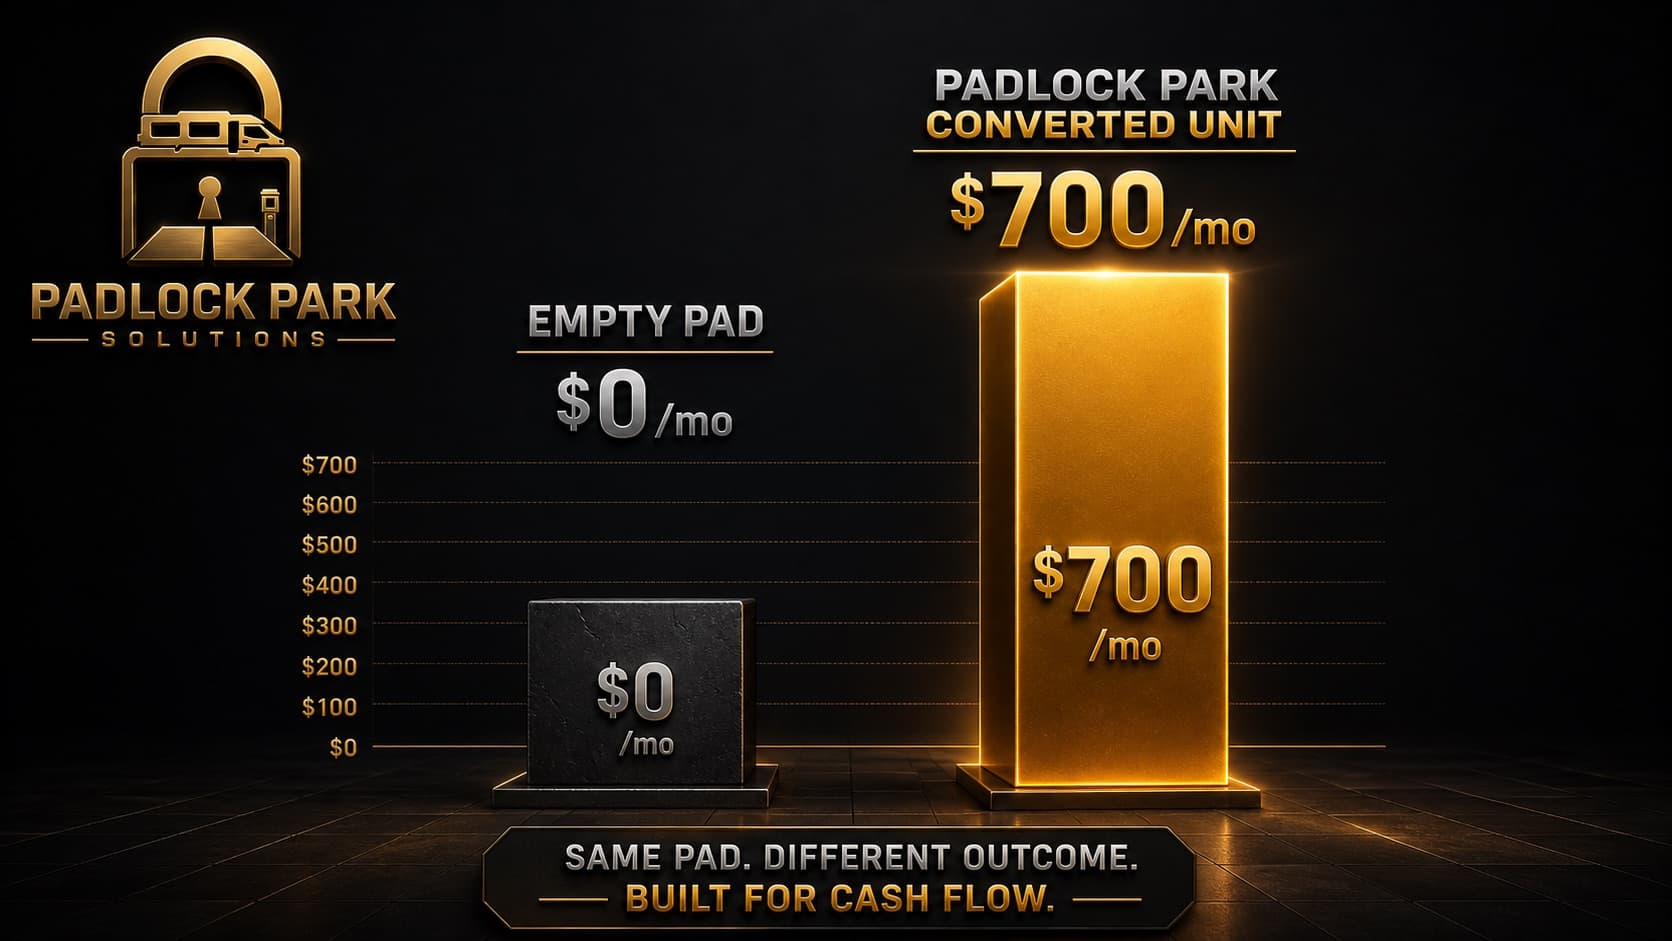
Same pad.
Different outcome.
Hard cap per unit
$7,500
Sourcing, inspection, towing, rehab, deployment. All in.
Speed to revenue
30 days
From sourced to first rent collected.
Annual potential
$8K–$54K
Per pad. Tenant ($8.4K/yr) to glamping (~$54K/yr).
5-unit pilot cost
$37,500
Minimum pilot: 5 units × $7,500. First rent arrives in 30 days.
The math doesn't argue. It just sits there.
What's inside the $7,500
Source acquisition
Auction lot price + buyer premium (Copart / IAA / GSA)
$1,200
16%
Bonded inspection
Pre-purchase mechanical + structural assessment
$350
5%
Transport & towing
Flatbed or drive-away depending on condition
$850
11%
Interior rehab
Weatherproofing, appliances, fixtures, cosmetics
$3,800
51%
Pad hookup + deployment
Electric, water, sewer tie-in + leveling
$550
7%
Contingency buffer
Structural unknowns, permits, final detail
$750
10%
Total (hard cap)
$7,500
Day 31 — your call
Long-term tenant
Revenue$700–$900 / month
Annual / pad$8,400–$10,800
Occupancy95–100% (12-mo leases)
Operating cost$0–$50/mo (maintenance reserve only)
Cash flowPredictable, stable
Best marketLabor corridors, workforce housing markets
RiskLow — long leases, stable demand
Glamping / nightly
Revenue$150–$300 / night
Annual / pad$27,000–$54,000 at 50% occ
Occupancy40–65% (seasonal)
Operating cost$150–$300/mo (platform fees, linens, cleaning)
Cash flowHigher ceiling, seasonal peaks
Best marketTourism corridors, destination parks
RiskModerate — demand is weather/season sensitive
3-year NOI projection — 5-unit pilot (per-unit basis)
| Year | Tenant | Glamping |
|---|---|---|
| Year 1 | +$1,500 | +$28,500 |
| Year 2 | +$18,000 | +$72,000 |
| Year 3 | +$27,000 | +$108,000 |
Tenant: $750/mo avg. Glamping: $200/night, 50% occ. Year 1 deducts $7,500 deployment cost. Green = cash-positive after deployment.
The alternatives
Salvage Class A (Padlock)
Cost
$7,500
Revenue / yr
$8K–$54K
Time to revenue
30 days
5-yr NOI
$37K–$263K
New Class A motorhome
Cost
$120K–$300K
Revenue / yr
$8K–$54K
Time to revenue
Immediate
5-yr NOI
-$170K–$60K
Stick-built cabin
Cost
$40K–$120K
Revenue / yr
$8K–$36K
Time to revenue
3–9 months
5-yr NOI
-$40K–$100K
Park model / tiny home
Cost
$35K–$80K
Revenue / yr
$6K–$24K
Time to revenue
2–4 months
5-yr NOI
-$27K–$62K
New manufactured home
Cost
$60K–$120K
Revenue / yr
$9K–$15K
Time to revenue
6–18 months (permits)
5-yr NOI
-$45K to -$15K
Do nothing (empty pad)
Cost
$0
Revenue / yr
$0
Time to revenue
Never
5-yr NOI
$0
State rent benchmarks
Achievable monthly rent and nightly glamping rates by market. Based on comparable workforce housing and short-term rental data.
| State | Market type | Tenant / mo | Glamping | Payback |
|---|---|---|---|---|
| TX | Houston / Dallas workforce | $750–$850/mo | $130–$200/night | 10 mo |
| AZ | Phoenix / Tucson labor corridor | $800–$900/mo | $150–$250/night | 9 mo |
| FL | Orlando / Tampa logistics | $775–$875/mo | $175–$300/night | 10 mo |
| CA | Central Valley agriculture / construction | $850–$1100/mo | $200–$400/night | 8 mo |
| CO | Front Range outdoor/tourism corridor | $850–$1000/mo | $200–$350/night | 9 mo |
| GA | Atlanta metro trades | $725–$825/mo | $125–$200/night | 10 mo |
| WA | Pacific NW construction / tech support | $900–$1100/mo | $175–$300/night | 8 mo |
| TN | Nashville / Smoky Mountain tourism | $700–$800/mo | $150–$275/night | 10 mo |
Ranges based on Furnished Finder, Airbnb comparable data, and operator-reported rates. 2024–2025. Payback calculated at midpoint tenant rate on $7,500 hard cap.
Risks & mitigants
We don't hide the risks. We engineer around them.
Unit condition worse than expected
MedBonded inspection before purchase commitment. Walk-away authority on every lot.
Transport cost overrun
LowHard cap includes 15% transport buffer. Local network preferred.
Tenant doesn't pay
LowStandard lease with security deposit. Month-to-month after 12 months = easy replacement.
Park zoning issue
LowOperator confirms zoning suitability before any acquisition. Not our risk to carry.
Market demand softer than projected
LowWe operate in both glamping and workforce housing — two independent demand pools.
Septic / utility capacity
MedEngineering review required before pilot. If capacity is insufficient, pilot doesn't start.
Regulatory change (RV habitability)
LowWe track state/county ordinance changes. Fleet is relocatable if single-market rules tighten.
Source availability dries up
Low30+ active sources across Copart, IAA, GovDeals, Manheim OVE, ADESA, and 25+ more. Diversified intake.
Track record: 0 of 8 risks materialized at Skyline Campground (6-month pilot). Individual results vary.
See the modelROI vs alternatives
Padlock Park (glamping)
400%
$7.5K → $36K/yr = 400%+ year-1 ROI at 50% occ
Padlock Park (tenant)
120%
$7.5K → $9K/yr = 120% year-1 ROI
Rental SFH (median)
8%
~8% cap rate on median US single-family rental
S&P 500 (10yr avg)
10%
10% annualized total return, no depreciation benefit
REIT index
9%
~9% total return, fully passive but illiquid in downturns
T-Bill (5yr)
4%
~4.5% yield, risk-free but capital locked
Data sources
Acquisition prices: Copart, IAA, GovDeals auction records. Rehab costs: contractor invoices, 2024–2025. Rental rates: Skyline Campground pilot data + comparable market listings. ROI benchmarks: S&P 500 historical, NCREIF REIT index, US Treasury. Last data audit: Q2 2025. Numbers updated as new pilot data arrives.
The demand backdrop
Workforce housing demand isn't cyclical — it's structural. New construction can't keep up. Salvage Class A conversion is one of the few paths to sub-$800 rent with a 30-day build time.
6.5M
Unit workforce housing shortage
NLIHC 2024
$1,850
Avg 1BR rent in Sun Belt labor markets
CoStar 2025
34%
Of US renters cost-burdened (>30% of income)
Harvard JCHS 2024
18mo
Avg time to permit new affordable housing
NAHB 2024
Glossary
- Hard cap
- The maximum all-in spend per unit regardless of acquisition price variance.
- Fit score
- Padlock's 0–100 rating for each salvage unit. Weighs damage type, images, class verification, price vs. market.
- Deployment
- The full process: source → inspect → acquire → transport → rehab → connect to hookups → lease/list.
- ISR
- In-place salvage ratio. Habitable square footage relative to equivalent new build cost. Drives the arbitrage.
- NOI
- Net Operating Income. Revenue minus direct operating expenses (not including debt service).
- Cap rate
- NOI ÷ total asset value. A $7,500 unit earning $9K/yr has a 120% cap rate.
- Diesel pusher
- Class A motorhome with a rear-mounted diesel engine. More durable powertrain, preferred for our acquisition profile.
- Acquisition cycle
- End-to-end process from sourcing a salvage lot to placing it at a partner park. Target: 30 days.
- LTV
- Lifetime Value — total revenue a pad generates over its life. $7,500 unit at $750/mo = $90K LTV over 10 years.
Ready to run your park's numbers?
Tell us about your park.
We'll build the model.
30-minute call. Real numbers for your specific pads, location, and target market.
Run my park's numbers